
Agile Defense · Deep dive
From one spreadsheet to a shared board.
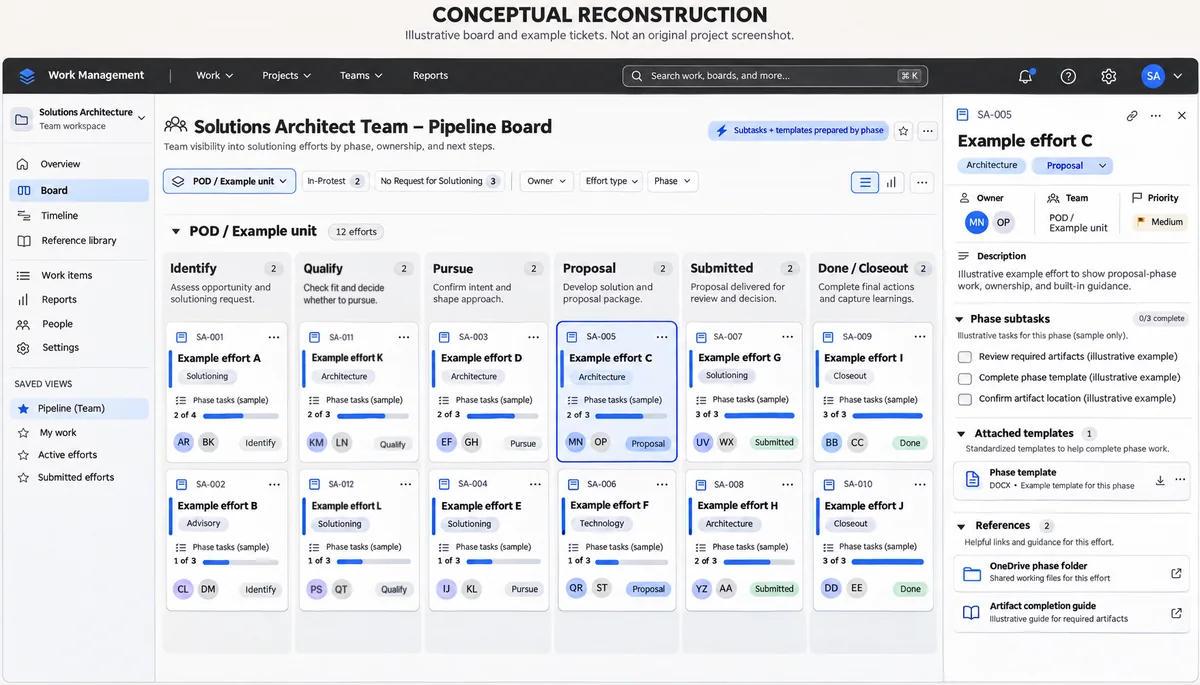
A Jira board helped the Solutions Architect team join work in progress and find what each phase required.
Results
A month
To design and build the board
Two weeks
Pilot, then only minimal changes
Every effort
Tracked on the board by the whole team
Project timeline and current use. Time savings are user-reported.
The tracker depended on one person.
The Solutions Architect team works through efforts in phases, and more often than not, someone joins an effort that’s already in progress.
The only tracker was an Excel sheet that one person kept. If that person left, the team would be scrambling to find or learn what only they knew.
- The sheet showed
- Which efforts were in which phase, which were up for recompete, and which upcoming bids the company qualified for
- Who it affected
- The new solutions architect, the lead onboarding them, and the team or program manager already running the effort
Start with what people knew.
I designed the board with the VP of Solutions. I ran discovery and rounds of interviews with the rest of the team so it fit the whole group.
How the board came together
- InterviewsWhich artifacts does each phase need, can people find them, and do they know what to do with them?
- TemplatesWith the VP of Solutions, I tracked down the artifacts that already existed and made them easier-to-use, prefilled templates
- Phase mapWe mapped what each phase looks like, which artifact it needs at which stage, and how to fill it out
- What I builtThe boardAutomations create each phase’s subtasks and attach its templates
Discovery workshops
Discovery included individual interviews and group workshops. The boards below come from the workshops, which I ran with the Solutions Architect team and the VP of Solutions. Each one is redrawn in a simulated board interface with paraphrased notes, and individual comments are left out.
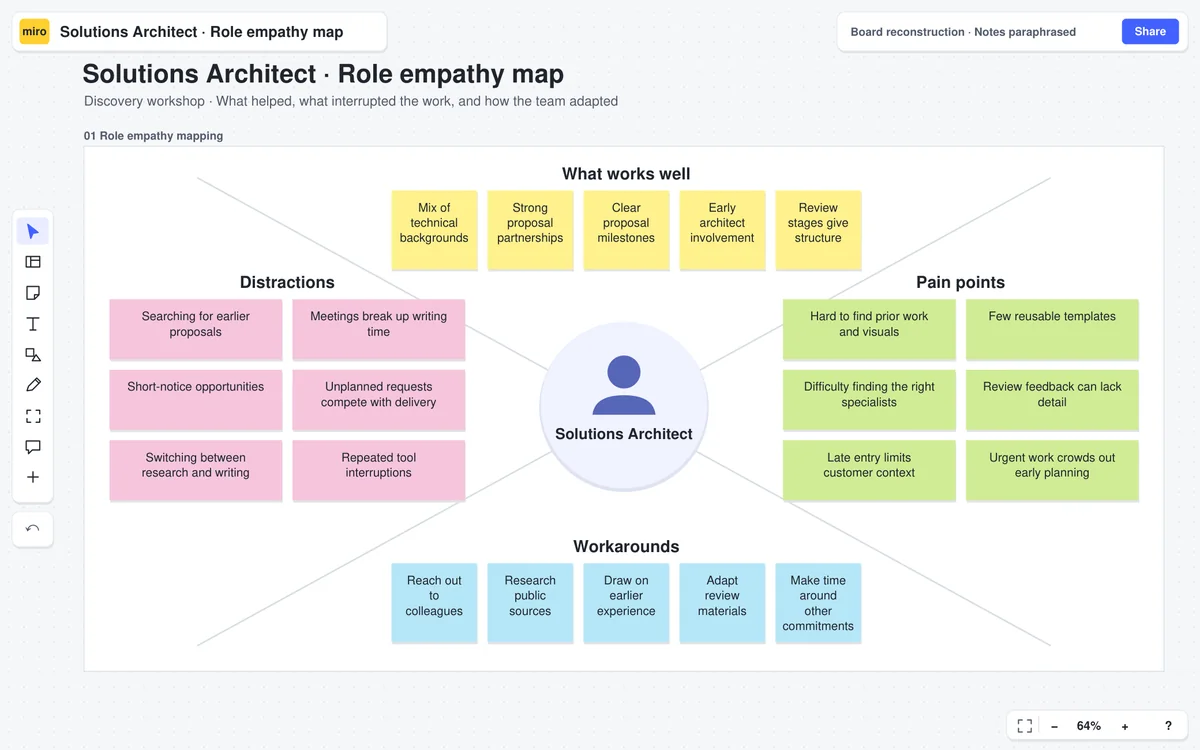
Participants described strong proposal partnerships and the value of early architect involvement. They also named short-notice requests, trouble finding prior work or specialists, and gaps in customer context. Workarounds included asking colleagues and researching public sources.
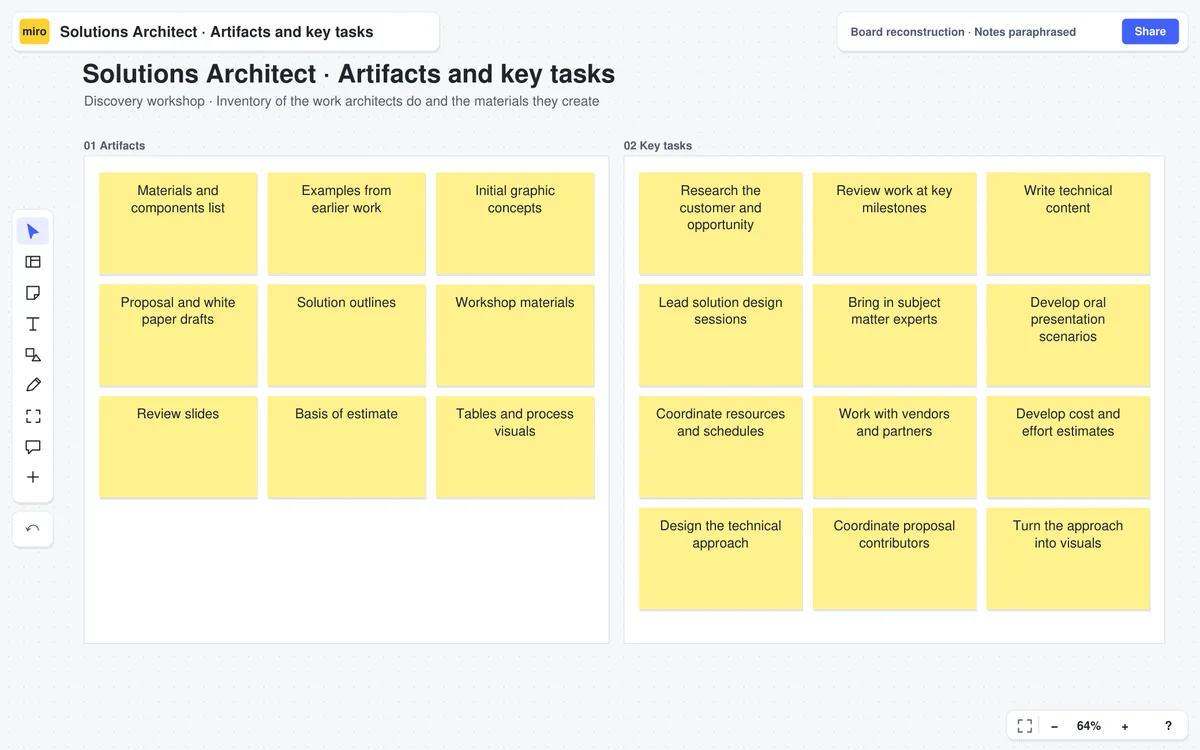
The artifacts include outlines, estimates, review slides and visuals. The tasks span research, technical writing, facilitation, specialist coordination and solution design. Both lists are selected examples.
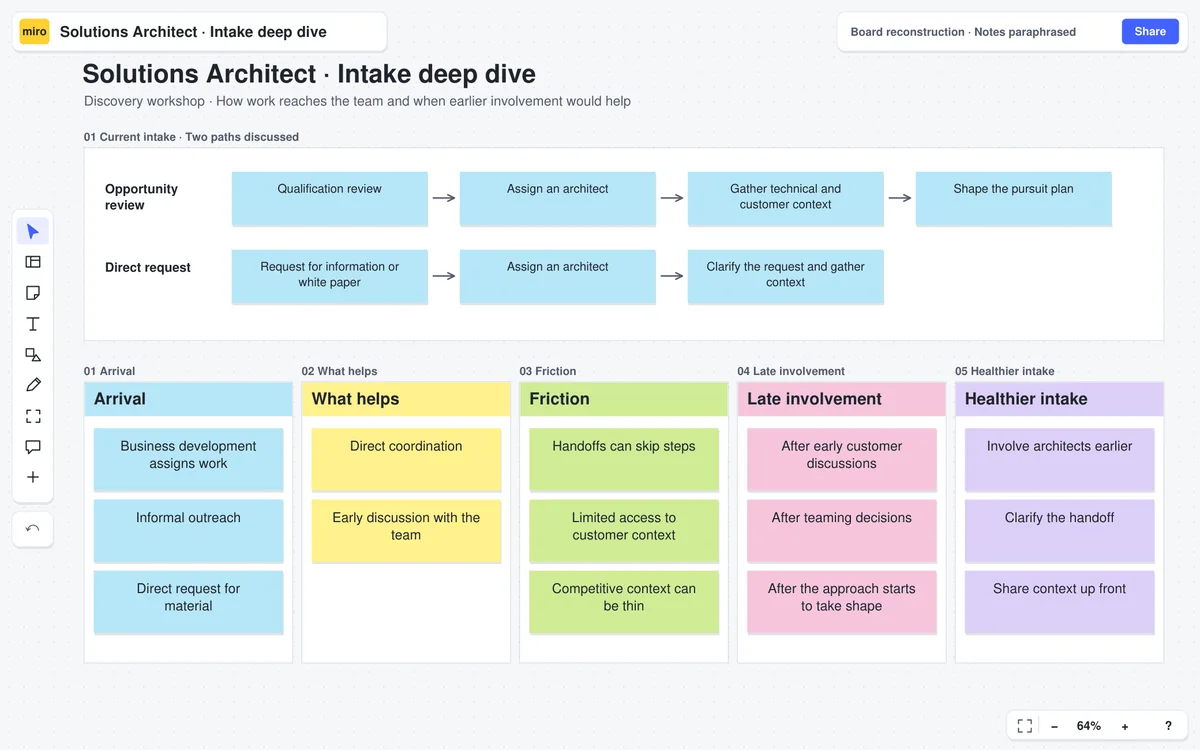
The workshop compared an opportunity review path with direct requests for material. It looked at how skipped steps and missing context affected the handoff, and what it would take to involve architects earlier. Earlier involvement, clearer handoffs and better access to context are ideas the workshop raised.
Process definition
Hard-to-find prior work came up in the first workshop, so I mapped which materials and templates belong in each phase.
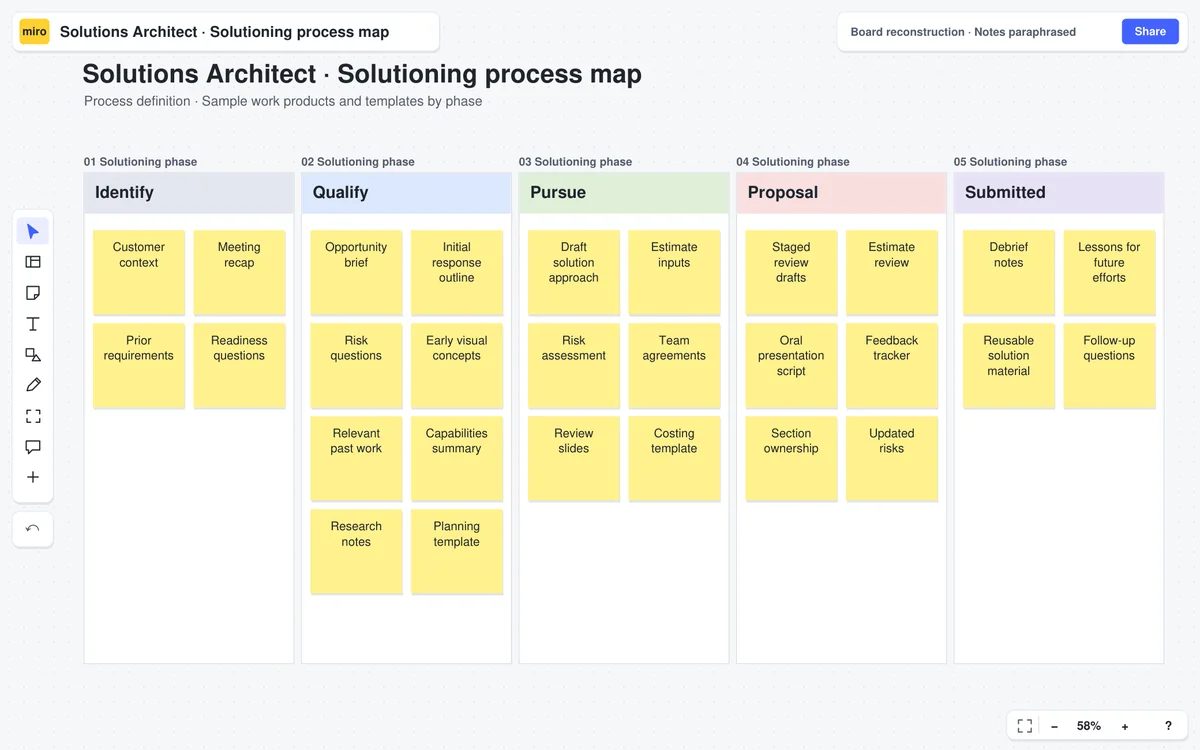
Customer context and prior requirements sit in Identify, early outlines and risks in Qualify, design and estimate inputs in Pursue, review materials in Proposal, and debrief and reuse material in Submitted. The artifacts are samples.
What an effort gets in each phase
The board follows six phases on the main path, and two side states.
- Identify
- Qualify
- Pursue
- Proposal
- Submitted
- Done / Closeout
- Side states
- In-Protest
- No Request for Solutioning
- Subtasks
- Created by automation for the phase
- Templates
- Attached to the tickets by automation
- Folder link
- The phase’s OneDrive folder
- Fill-out reference
- How to complete each artifact
Let the daily users shape the final board.
Interview everyone, not only the VP of Solutions
WhyThe VP of Solutions’ sense of what people knew didn’t always match what team members told me. In the interviews they showed me what they didn’t actually know, and we addressed those gaps.
Prefill the templates and automate the setup
WhyThe templates keep the work consistent and complete, and the automations mean each phase always has what it needs.
Add the views the team asked for after the pilot
TradeoffI’d have kept the board leaner than it ended up. After the pilot, the team asked for a couple more categories, a timeline view showing who owned what and how many efforts each person was running at once, so future work could be assigned with that in view, and a swim lane that groups tickets by POD to show each business unit. I’d have cut some of that. I conceded because it mattered to the people using the board every day, and the team loved it.
The board is now the team's source of truth.
The whole Solutions Architect team now uses the board on every effort, and it replaced the Excel sheet. A new solutions architect can join an effort already in progress, at any phase, and know what to do and where to find it, without tracking someone down to ask.
The person who used to keep the Excel sheet says the board saves time and is much easier to use and read, and leadership loves it too. The board took a month to design and build. A two-week pilot followed, and it needed only minimal changes afterward.
An Excel sheet that one person kept
- Which efforts were in which phase
- Which were up for recompete
- Which upcoming bids the company qualified for
A Jira board the whole team uses
- Subtasks and templates created for each phase by automation
- A timeline view of who owns what and how many efforts each person is running
- A swim lane by POD, which shows each effort’s business unit
The same job before and after the board.